4

What are the labels for the minor ticks in a log scale graph?

enter image description here

I would like to label them. So, I want to know how to calculate the value for each of the minor tick.

jhyap
  • 243
  • 2
  • 3
  • 8
  • 2
    Not sure I understand the question. Do you want to put some labels there? Do you have technical problems doing so? Or are you unsure as to what the lines indicate, or how to name them? – slhck Apr 11 '14 at 14:56
  • I would like to label them. So, I want to know how to calculate the value for each of the minor tick. – jhyap Apr 11 '14 at 14:59
  • 2
    10^.1 then 10^.2 then 10^.3, etc. – EBGreen Apr 11 '14 at 15:04
  • @EBGreen It appears from this chart that there are not enough marks for a count of 0.1-0.9 between? There are only 8 lines between the major points. – Gaffi Apr 11 '14 at 15:06
  • The 9th one is too close to 10^1 to display. – EBGreen Apr 11 '14 at 15:08
  • In between 10^0, 10^1, 10^2, 10^3, there are minor ticks. What would be the label for each of the minor ticks? – jhyap Apr 11 '14 at 15:11
  • @EBGreen Makes sense, I suppose. In other words, if the total range of the image above were 10^0-10^1, each point (0.1-0.9) would then fit, given the size/resolution of the image. Correct? – Gaffi Apr 11 '14 at 15:17
  • I would imagine. – EBGreen Apr 11 '14 at 15:18
  • if each point is 0.1, 0.2, 0.3 ... 0.9, then there would be an equal interval instead of moving close to 1 – jhyap Apr 11 '14 at 15:22
  • @jhyap I'm reducing my keystrokes. I mean `10^0.1, 10^0.2, 10^0.3...` – Gaffi Apr 11 '14 at 15:24
  • I see. it seems make sense. I would try it out on monday when back to work. – jhyap Apr 11 '14 at 17:14
  • how about for case `10^1` to `10^2`? – jhyap Apr 14 '14 at 06:50

1 Answers1

8

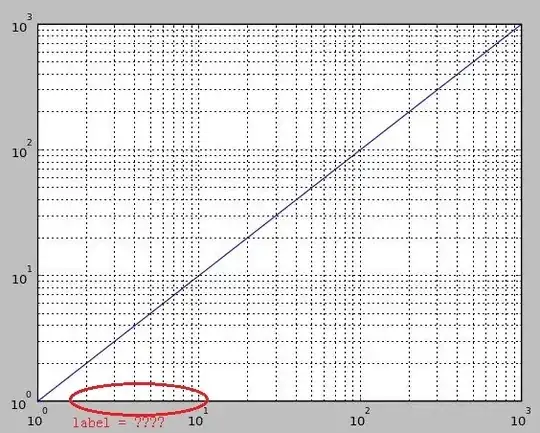
I'm not sure of the correct mathematic way to describe this, but for your chart, using log10, your increments are going to be 1/10 of the values between each major grid mark.

  1. Grid 10^0 (1) to 10^1 (10), your values will be 1, 2, 3, 4, 5, 6, 7, 8, 9, 10
  2. Grid 10^1 (10) to 10^2 (100), your values will be 10, 20, 30, 40, 50, 60, 70, 80, 90, 100
  3. Grid 10^2 (100) to 10^3 (1000), your values will be 100, 200, 300, 400, 500, 600, 700, 800, 900, 1000

Just repeat as necessary. Here's a sample with labels:

enter image description here

dav
  • 10,021
  • 5
  • 30
  • 52
  • Thanks for your answer and you catch the point. You might interest to get a look on my question in SO:http://stackoverflow.com/questions/23007088/jqplot-how-to-show-minor-grid-in-log-scale-graph/23073042#23073042 – jhyap Apr 15 '14 at 01:24