2

have some data that has gaps in it and Im not able to plot it in excel. I know I want to uncheck the "Leave Gaps" item in the Tools / Chart / Options panel. Plenty of googling has showed that that's the answer I want. But, I'm using Excel 2008 for OS X, not for Windows. And I can't seem to find that option anywhere!
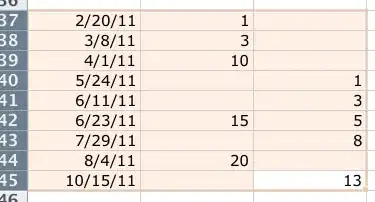
Here's my data:

data

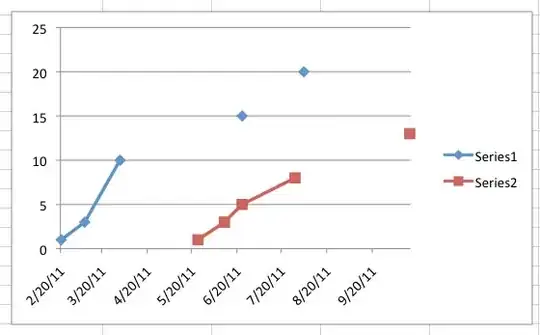
Here's my graph from Excel:

excel graph

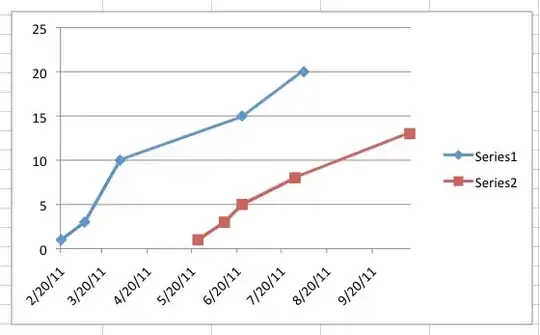
and here's what I want. (Drew this in Photoshop)

desired graph

How can I do this in Excel 2008 for OS X? Thanks!

Paul Cezanne
  • 117
  • 1
  • 11

2 Answers2

2

Under Preferences> Chart

I am not sure 2008 and 2011 are the same but in 2011

enter image description here

enter image description here

you must do more than uncheck "Leave Gaps"

Check Interpolated

enter image description here

datatoo
  • 3,440
  • 20
  • 31
1

In Excel for Mac 2008: the dialog is in the same place as in 2011 (ie Excel>Preferences>Charts) but it is greyed out unless there is a chart in your worksheet, AND you have clicked on the chart before going to preferences AND it is a chart type which supports interpolation (basically X-Y scatter).

It was all a lot less demanding in PC versioon

AdamMac
  • 11
  • 1